
Business Process Modelling is a surprisingly complex topic in Business Process Management (BPM) with many different approaches. In this step-by-step, easy-to-follow guide I will try to remove the complexity and also explore one approach that many Triaster customers have found useful.
The potential application areas of this approach, and the nature of the business challenges that can be addressed are wide. Do you want to reduce costs? Strip out waste? Improve quality? Do you need to increase efficiency to compete? Or maybe staff are tired of ineffective processes and you need to improve morale...
Many of these challenges can be addressed with Business Process Modelling tools and analysis; let’s start with looking at Time and Effort…
Capturing Time and Effort in Process Maps
Suppose John says at 10am on Monday, “that report will take me a couple of hours to finish.”
What does he mean? When will he finish the report? Noon on Monday?
He then goes on to say, “but I’m a bit tied up at the moment and can’t get to it until 2pm on Thursday.”
OK, so he will finish by 4pm on Thursday?
“Don’t forget though”, he says, “we have that team building exercise on Thursday at 3 that’ll take the rest of the day, and I’m in late on Friday around 10am.”
OK, so 11am on Friday?
“And the other thing is, I’ll need to get a sign-off on section A of the report from Mary before I can complete section B. Looks like Mary goes on leave for a couple of weeks on Friday….”
OK, so the report won’t be finished for at least 3 weeks, even though John starts with the truthful, but highly misleading statement: “that’ll take me a couple of hours.”

What do we mean by Time, Effort and Resources?
We need to separate out elements of time and effort, and define them in the process if we are to be accurate.
A typical model is to identify at least 3 time metrics as follows:
Effort – the actual time spent doing the work. Also called Processing Time. This is John’s 2 hours.
Queuing Time – the time delay before work begins. Also called Buffer Time. This is John’s “I’m tied up until Thursday.”
Interruption Time – the time between starting a task and finishing it during which no Effort is performed. Also called Delay Time or Wait Time. This is John’s break for the team building and waiting on Mary’s sign-off.
Resources are the number of people that can perform the work. A simplifying assumption, but one that is commonly made in modelling, is that the actual clock time to complete a task is the Effort divided by the number of Resources.
In John’s case, there is 1 resource writing the report, so it takes 2 hours of clock time. If there were 6 resources, the same 2 hours of effort would only take 20 minutes of clock time.
The total time taken from beginning to end is often called the Cycle Time, End-to-End Process Time or Elapsed Time. It is: (Effort/Resources) + Queuing Time + Interruption Time.
Clearly, Queuing Time and Interruption Time are always non-value adding.
There are other aspects of Time measurement that are commonly included. For example, Transit Time is often modelled, this being the time taken for John’s report once finished to find its way back to the requester. If the report were hard copy and had to be couriered or posted, it adds days to the Cycle Time.
Specifying Time Units in Business Process Modelling
“That’ll take 4 days” says John.
What does he mean?
Is it 96 hours of effort? Or is it 30 hours of effort?
Does he mean to include Saturday and Sunday, or working days only?
It is important to be clear what units are being used whenever a time period or an amount of effort is being specified.
Typical units of time in process maps are Seconds, Minutes, Hours, Working Day (7.5 Hours), Calendar Day (24 Hours) and so on. Whenever a time is specified, so should the units.
Specifying Cost Units in Process Modelling
Costs are generally labour costs (those associated with effort), and Other Costs.
Labour costs are often converted to an hourly cost according to some multiple of annual salaries. The specific method to do this matters less than its consistent application.
For example, it could be modelled on the basis of 260 working days per annum, and 7.5 hours per working day. So, annual salary is divided by 260*7.5=1950 to give an hourly rate.
Another model is to say there are 52 weeks per annum and 40 hours per week, giving a divisor of 2080.
Each organisation views these things differently, so each organisation needs to be able to define the precise Business Process Model to meet its needs.
Other Costs can arise from a whole host of considerations. For example, suppose you are modelling a University Enrolment process that sends letters to all enrolled students, and you are trying to identify cost savings from going down an email only route. In this case you will need to model postage and printing costs.
By and large, any cost line should have a unit cost field and a quantity field – for example 12,000 letters at a unit cost of 8p to print and 78p to post.
Flexibility in Data Definition is the Key
The important thing is to be able to model whatever metrics you need in order to find the answers you are looking for. And to be able to refine the model when the business analysis needs become clearer.
Atomic Data and Calculated Fields
Atomic data are the indivisible data fields, i.e. those that cannot be inferred from other data.
Clearly then, non-atomic data can always be computed.
For example, Labour Cost = Wage Cost per Hour * Hours of Effort. Labour Cost is a computed field, and the other 2 fields are the atomic data.
In a modelling environment, one should always seek to only store the atomic data, and let the system compute the calculated fields. In the above example, Labour Cost should never be entered directly.
Taking the example a little further, Wage Cost per Hour could also be a computed field as follows:
Wage Cost per Hour = Pay Band Median / 1950.
In other words, the Pay Band is the atomic data, and the salary is inferred from the pay band information and not entered directly.
The more you can break your data down into the atomic data fields, the easier it will be to maintain and update your model.
Modelling Business Processes: How Can Triaster Help?
Triaster have a completely flexible data modelling environment. Literally every field you want can be added. Calculated fields can be defined (and re-defined as needed).
For example, in the image below, there are a variety of basic properties most customers capture routinely.
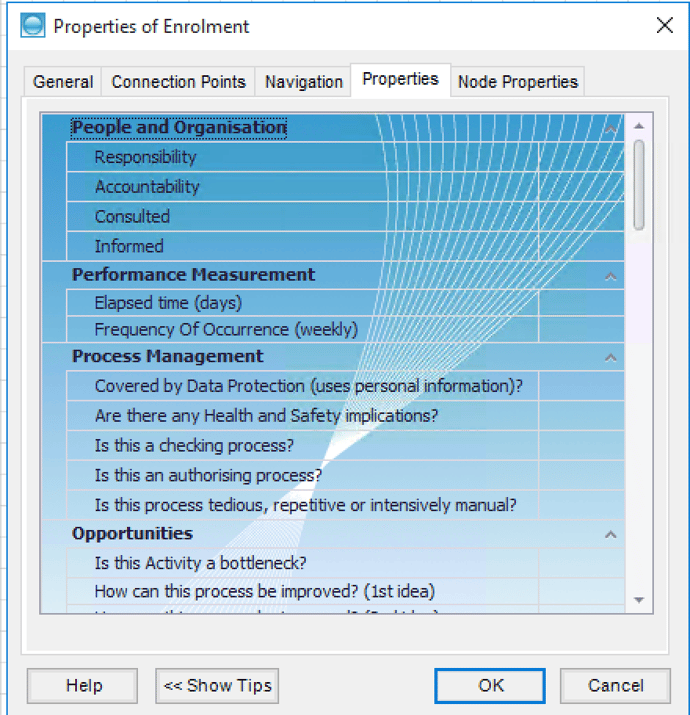
For Time and Resources, Triaster has been configured to model Effort, Wait Time and Queue Time. Note the Pay Band field which is used instead of a cost per unit of effort.
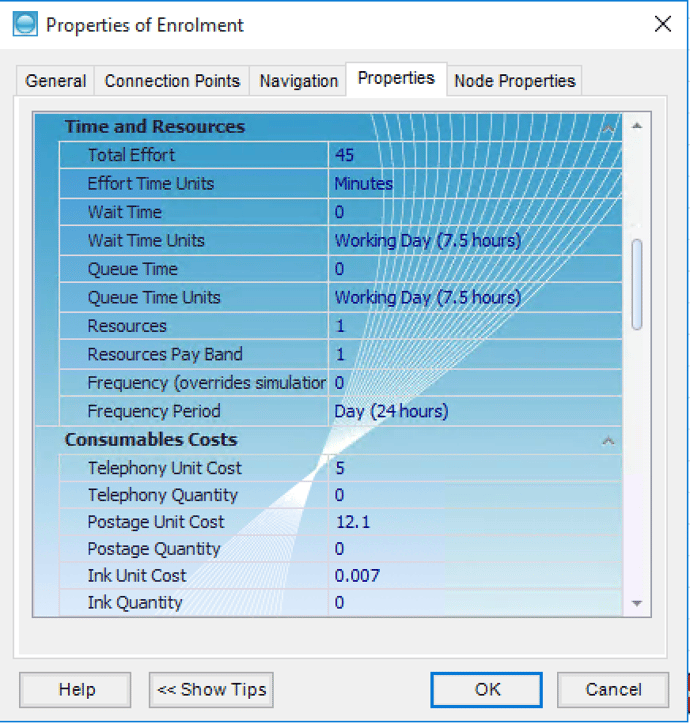
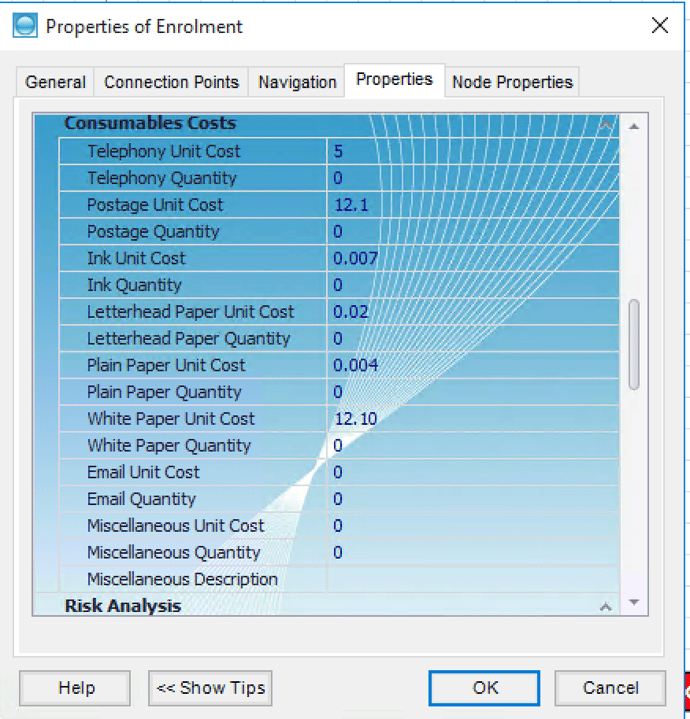
There is a section devoted to the cost of consumables…
Having entered the atomic data shown above, the system can then start to calculate the various lines of cost and cycle time…
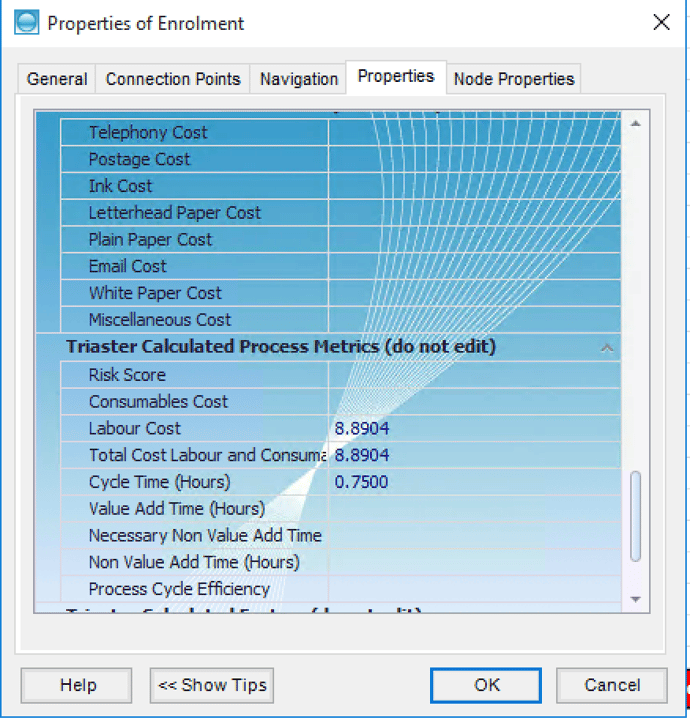
Triaster can then also compute end-to-end costings and total process cycle time through its dynamic simulation engine.
Visit the PDF 'An Introduction to Business Process Modelling' for a more in-depth explanation on the subject as a whole.
If you would like to learn more about modelling time, effort and cost data in process maps and take a detailed look at simulation theory and practice, please download our Business Analysis whitepaper here:

Please comment below if you'd like to add anything and use the social buttons below to share this article with others if you found it useful
Related articles:
Process Mapping: How can it save you money?
How can Triaster save your organisation money? [Infographic]
How to cost a process to identify savings in an organisation