The purpose of Value Stream maps are to visualise delays, restraints and excessive inventory within processes. They are also used to identify, reduce and remove waste (e.g.extra time and cost) in the process.
There are many excellent resources out there on how to boost your business by creating value stream process maps - however, my favourite is this one written by Lean Manufacturing Tools. In a nutshell, the article deals with how to carry out a value stream project alongside a business process management system (BPM system), which many Triaster customers have done.
Implementing Value Stream Mapping Software Within a BPM System
1. Process Discovery
What matters most is that this is a team exercise and should involve representatives from all interested parties that interact with the process.
It is a good idea to have an impartial and professional facilitator to run these sessions, as well as people from other areas of the business to verify the handover points. This blog on how to run a process map facilitation session is very useful when planning these events.
Scope is very important here: in general, I would recommend having the start and end point agreed initially as your goalposts and then work to fill in the gaps.

At Triaster, we are all about simplicity and because of this, we recommend using the Noun-Verb process map methodology, which only requires two main shapes.
Noun-Verb focuses as much as possible on the Deliverables that are produced throughout a process. We believe that Activities have no value, but rather attract a cost, whether that is in terms of budget, time, or resources. The value of a process is in the Deliverables that are produced by the Activities undertaken.

To effectively capture the Deliverables, consider asking the following questions:
'What does that Activity produce?' or 'What do you have now that you didn't have before?' We also consistently challenge the Activities undertaken throughout a process to ensure that there is a legitimate valuable output produced by every activity. If it is not obvious what is produced by carrying out an Activity, it probably indicates that the Activity is plagued by one of the 7 wastes.
2. Capture and Store Data Within the Process Maps Within Your BPM System
Once you have your process up on the wall in sticky note form, it will need digitising in form of a value stream mapping software. This can be a process mapping tool such as Process Navigator, which will help you create a process library within your business process management system.
To get any sort of long term sustainable improvement from a value stream process mapping project, you’ll want to be collecting data along the way and adding it in to your process maps, this should be easily achieved within your business process management system, if not, contact us to find out how we do it.
This data can be used to both:
- Identify areas for potential improvement
- Measure the success of implemented process improvement ideas
3. Report on the Data Within the Process Maps Within Your BPM System
Your business process management system should allow for easy reporting and searching. Once the data is in the system, it should be easy to get out. Your BPM System should also be able to calculate some of the specific data to give you your process cycle efficiency for example, and aggregable cost data.
The data I’d recommend recording if you have it available is cost, effort, frequency of occurrence, risk, queue time and the value stream status of each activity.
4. Value Stream Mapping Stages:
- Value Adding (If a typical customer is willing for the costs of an Activity to be added to the price of the product they purchase, the Activity is probably value-adding)
- Non Value Adding (Non-value adding Activities are those for which the customer would feel it would be very unfair to add a direct charge to them)
- Necessary Non Value Adding (Necessary non-value adding Activities are those for which the customer would feel costs are in some sense reasonable, but would still feel disgruntled if the costs were passed onto them)

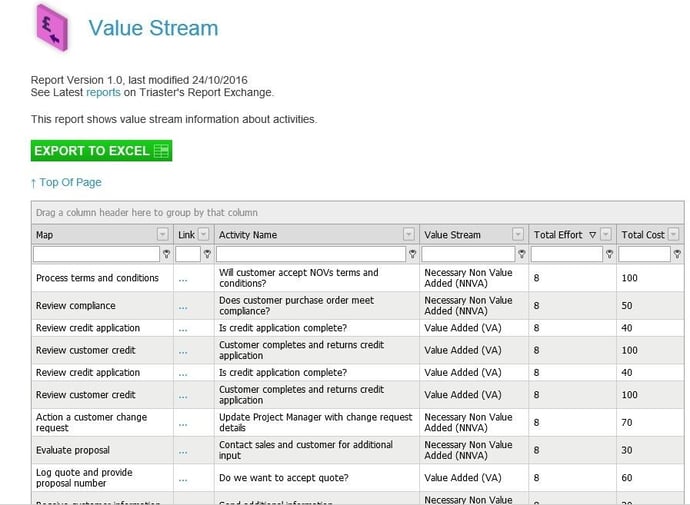
Using the above report, you can see which Activities have which value stream status and with the click of your mouse, you can sort, filter and search through these results. It is also possible to pull other useful pieces of data into the report.
As you can see here, I have chosen total effort and cost. These other useful pieces of data can also be filtered, sorted and searched accordingly and would help to identify which of my wasteful activities cost the most in time and money, helping to identify where to focus my process improvement energy first off.
Other data you could pull into this report could be process cycle efficiency, queue time, resource and frequency of occurrence.
I hope you found this article not only interesting but also useful, and encourage you to take a look to our  , which is designed to give an overview of how you could improve your own business processes.
If you're interested in learning more about continuous improvement, please feel free to have a read of Triaster's continuous improvement guide.
Related Articles:
What is the Noun-Verb process mapping methodology?
Written by Lynn Dudenhoefer
Lynn joined Triaster in November 2017 as the new Inbound Marketing Executive. Prior to her work with Triaster, Lynn worked in content management and studied at the University of Oxford. In June 2018 Lynn returned to Germany with her husband Brad.

